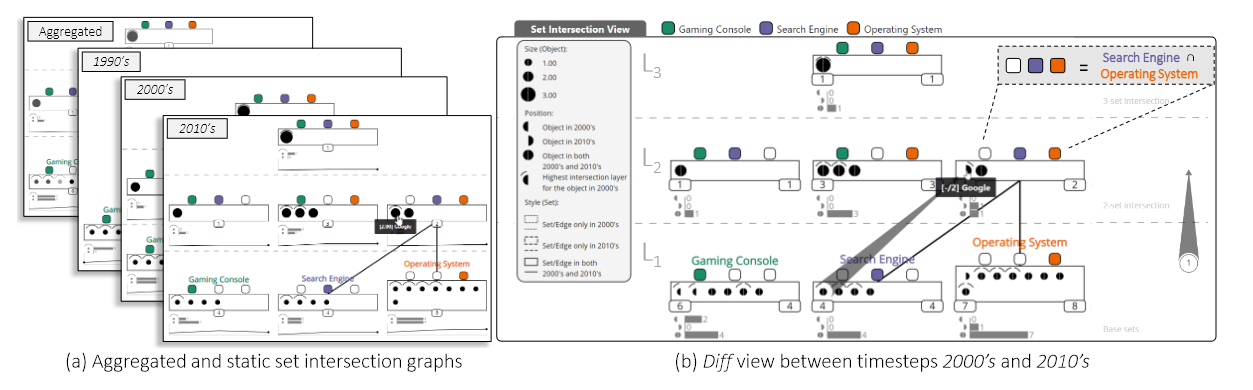
 Layered set intersection graphs showing types of products (sets) made by companies (elements).
Abstract
Challenges in set visualization include representing overlaps among sets, changes in their membership, and details of constituent elements. We present a visualization technique that addresses these challenges. The approach uses set intersection graphs that explicitly visualize each set intersection as a rectangular node and elements as circles inside them. We represent the graph as a layered node-link diagram using colors to indicate the sets. The layers reflect different levels of intersections, from the base sets in the lowest layer to potentially the intersection of all sets in the highest layer. We provide different perspectives to show temporal changes in set membership. Graphs for individual, two, and all timesteps are visualized in static, diff, and aggregated views. Together with linked views and filters, the technique supports the detailed exploration of dynamic set data. We demonstrate the effectiveness of the proposed approach by discussing two application examples. The supplemental material contains the prototype itself and a video showing the proposed interactions.